| Period | Scrobble count |
|---|---|
| 1 | 25 |
| 2 | 40 |
| 3 | 36 |
| 4 | 54 |
| 5 | 22 |
| 6 | 88 |
| 7 | 45 |
| 8 | 30 |
| 9 | 31 |
| 10 | 19 |
| 11 | 36 |
| 12 | 52 |
| 13 | 29 |
| 14 | 52 |
| 15 | 62 |
| 16 | 69 |
| 17 | 33 |
| 18 | 54 |
| 19 | 47 |
| 20 | 76 |
| 21 | 18 |
| 22 | 16 |
| 23 | 20 |
| 24 | 44 |
| 25 | 15 |
| 26 | 61 |
| 27 | 97 |
| 28 | 2 |
| 29 | 0 |
| 30 | 0 |
B_eeG
Last.fm Pro
April 2025
Scrobbles
1,173
Top Music
Artists
101
 43%
43%
New Artists
4%
 34%
34%
Albums
145
 3%
3%
New Albums
9%
 40%
40%
Tracks
206
 24%
24%
New Tracks
9%
 67%
67%
Charts
Music ratio
Tracks
206
vs. 271
(last month)
(last month)
Albums
145
vs. 141
(last month)
(last month)
Artists
101
vs. 71
(last month)
(last month)
Listening fingerprint
- B_eeG
- Global average
| Category | Category Explanation | User Data | Global Data | Tooltip Value |
|---|---|---|---|---|
| Consistency | Describes how regular your music habits are. Higher percentages mean you scrobbled on more days throughout the month. | 93 | 78 | 93% Consistency |
| Discovery Rate | How much new music you listened to this month. Higher percentages mean you discovered more new artists. | 4 | 21 | 4% Discovery Rate |
| Variance | How diverse your listening was this month. Higher percentages mean you explored more tags. | 58 | 28 | 58% Variance |
| Concentration | How long you spent listening to your favourite artists. Higher percentages mean you spent more time with your favourites. | 91 | 51 | 91% Concentration |
| Replay rate | How often you returned to your favourite songs. | 82 | 48 | 82% Replay rate |
Music by decade
| Decade | Scrobbles | Top Album | Image | Top Decade |
|---|---|---|---|---|
| Pre-1960 | 0 | /static/images/listening-report/v3/default_album.c052a79f9ec6.svg | ||
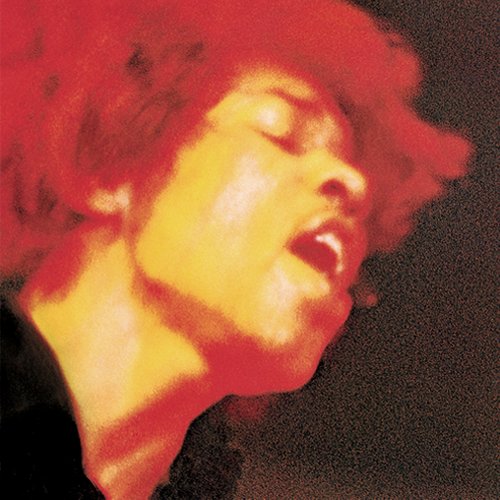
| 1960s | 2 | Electric Ladyland by Jimi Hendrix | https://lastfm.freetls.fastly.net/i/u/60x60/d8c6e57a027c4833c82b2ebcf2886892.jpg | |
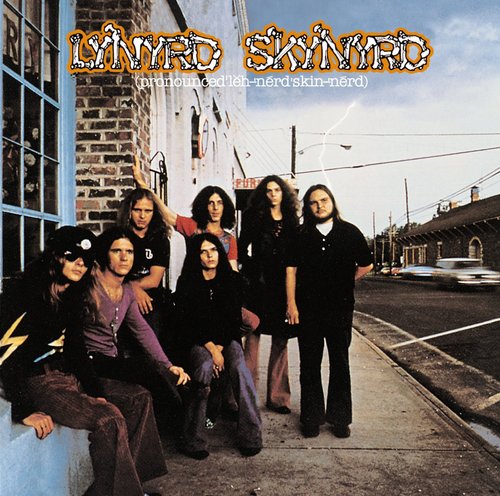
| 1970s | 1 | Pronounced' Leh-'Nerd 'Skin-'Nerd by Lynyrd Skynyrd | https://lastfm.freetls.fastly.net/i/u/60x60/31c0e29aba21f5442fc0a48958c91394.jpg | |
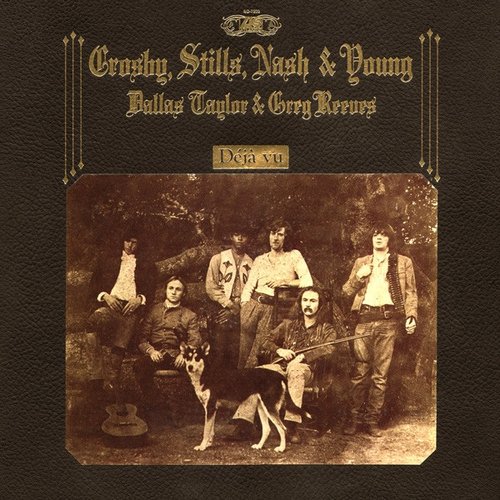
| 1980s | 3 | Deja Vu by Crosby, Stills, Nash & Young | https://lastfm.freetls.fastly.net/i/u/60x60/6bb5533261da63d1c0f1d2f1668c00e3.jpg | |
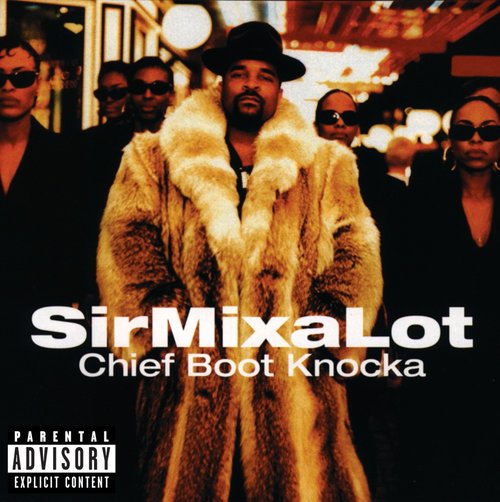
| 1990s | 2 | Chief Boot Knocka by Sir Mix-A-Lot | https://lastfm.freetls.fastly.net/i/u/60x60/642503730c765a2e322bd2f4ee7c40a4.jpg | |
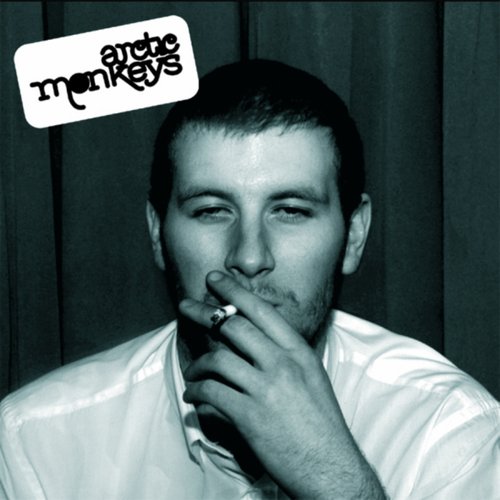
| 2000s | 10 | Whatever People Say I Am, That's What I'm Not by Arctic Monkeys | https://lastfm.freetls.fastly.net/i/u/60x60/5e1480805bdf29da606e0de2ac07b205.jpg | |
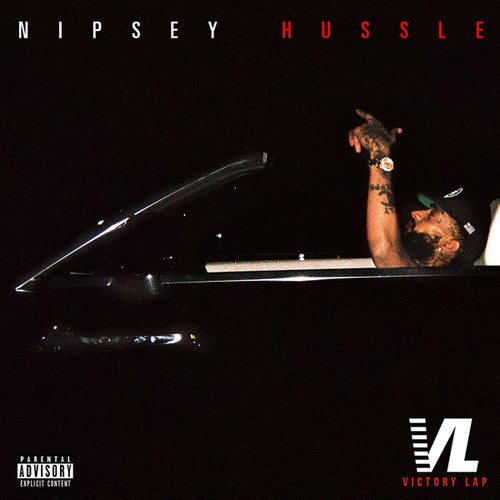
| 2010s | 17 | Victory Lap by Nipsey Hussle | https://lastfm.freetls.fastly.net/i/u/60x60/40dcc2b285f564279b82bef2227a3617.jpg | |
| 2020s | 1054 | Backflips in a Restaurant [Explicit] by grentperez | https://lastfm.freetls.fastly.net/i/u/60x60/f9b4f588f2d3a480a936f6f55c9175b6.jpg | true |
Listening clock
| Hour | Scrobble count | Average scrobble count |
|---|---|---|
| 0 | 20 | 2.8 |
| 1 | 16 | 1.6 |
| 2 | 10 | 6.8 |
| 3 | 0 | 5.8 |
| 4 | 0 | 4.0 |
| 5 | 0 | 6.0 |
| 6 | 55 | 46.2 |
| 7 | 256 | 165.2 |
| 8 | 107 | 97.0 |
| 9 | 41 | 61.8 |
| 10 | 43 | 42.4 |
| 11 | 52 | 43.2 |
| 12 | 52 | 40.6 |
| 13 | 29 | 36.8 |
| 14 | 36 | 29.8 |
| 15 | 51 | 36.0 |
| 16 | 25 | 43.6 |
| 17 | 22 | 44.0 |
| 18 | 67 | 49.6 |
| 19 | 50 | 67.2 |
| 20 | 99 | 45.6 |
| 21 | 79 | 48.6 |
| 22 | 43 | 36.8 |
| 23 | 20 | 10.6 |
- 6 month average
Busiest hour
7:00am
Scrobbles in busiest hour
256
Mainstream score
B_eeG is balanced!
63% mainstream score
Quick facts
Listening time
2
days, 15 hours
 14%
14%
vs. 3 days, 1 hour (last month)
Average scrobbles
39
/day
 10%
10%
vs. 43 (last month)
Community
Last.fm
Want your own personalised listening stats? Join millions of users already tracking and discovering music with Last.fm. All for free.
-
Your music stats, live
View your stats in real time, or receive weekly reports.
-
Find music you love
Recommendations based on your listening history.
-
Rediscover your music
Every song you've ever listened to, all in one place.
- …and much more!


